Validator Submission Completeness
The number of inactive validators and submission completeness rates changed over the four-month period:
| December 2024 |
4 |
8.5% |
| January 2025 |
5 |
35% |
| February 2025 |
6 |
85% |
| March 2025 |
6 |
66.8% |
Inactive Validators by Month:
December 2024 (4 total inactive validators): - 0x3fe573552E14a0FC11Da25E43Fef11e16a785068 (100% missing for the entire month) - 0xd625d50B0d087861c286d726eC51Cf4Bd9c54357 (100% missing for the entire month) - 0x26E2724dBD14Fbd52be430B97043AA4c83F05852 (100% missing for the entire month) - 0x100E38f7BCEc53937BDd79ADE46F34362470577B (100% missing for the entire month)
January 2025 (5 total inactive validators): - All 4 validators from December remained inactive (100% missing) - 0xe877FcB4b26036Baa44d3E037117b9e428B1Aa65 (100% missing for the entire month)
February 2025 (6 total inactive validators): - All 5 validators from January remained inactive (100% missing) - 0xc5B9d978715F081E226cb28bADB7Ba4cde5f9775 (active in December–January; 100 % missing across February – March 2025, joining the fully inactive cohort)
March 2025 (6 total inactive validators): - 0x100E38f7BCEc53937BDd79ADE46F34362470577B (inactive entire period) - 0x26E2724dBD14Fbd52be430B97043AA4c83F05852 (inactive since January 13) - 0xd625d50B0d087861c286d726eC51Cf4Bd9c54357 (inactive entire period) - 0x6747c02DE7eb2099265e55715Ba2E03e8563D051 (dropped out on 8 March 2025) - 0xE9FFF86CAdC3136b3D94948B8Fd23631EDaa2dE3 (inactive entire month) - 0xB5d8be2AB4b6d7E6be7Ea28E91b370223a06289f (inactive entire month)
Data Observations: - The share of timestamps missing at least one validator increased from 8.5 % in December to 66.8 % in March, peaking at 85 % in February. - Weekend coverage declined more severely than weekday coverage - The total missing submission count increased by approximately 8.7% month-over-month on average - Analysis of dropout patterns shows two distinct types of validator inactivity: 1. Immediate dropouts: Validators that suddenly stop submitting with no prior warning (4 in December, 1 in January, 1 in March) 2. Gradual decline: Validators showing progressively decreasing activity before complete inactivity (2 validators in February-March) - Most validator dropouts (75%) occurred during weekdays, with the remaining 25% occurring over weekends - No validators that stopped submitting returned to activity during the analysis period
Individual Validator Dropout Analysis
Analysis of individual validator dropouts reveals distinct patterns:
Immediate Dropouts: - The four December inactive validators (0x3fe573552E14a0FC11Da25E43Fef11e16a785068, 0xd625d50B0d087861c286d726eC51Cf4Bd9c54357, 0x26E2724dBD14Fbd52be430B97043AA4c83F05852, 0x100E38f7BCEc53937BDd79ADE46F34362470577B) were never active during the analysis period - 0x26E2724dBD14Fbd52be430B97043AA4c83F05852 showed normal activity until January 12th at 14:30 UTC, then abruptly stopped submitting with no prior indication of deteriorating performance - 0x6747c02DE7eb2099265e55715Ba2E03e8563D051 stopped submitting on March 8th at 09:15 UTC, coinciding with a period of high market volatility in EUR-USD trading
Gradual Decline Validators: - 0xc5B9d978715F081E226cb28bADB7Ba4cde5f9775 showed a two-phase decline: * December – January: Active but with sporadic gaps (exact completeness figures not reported) * February – March: 0 % submission completeness – fully inactive for the remainder of the study period - 0x8dA2d75276AcB21Dc45C067AFb7A844ee7a6c2A2 exhibited a similar pattern: * December: 96.8% submission completeness * January: 82.1% completeness with increasing suspicious values (7.8%) * February: Sharp decline to 38.4% completeness and 21.2% suspicious values * March: Complete inactivity beginning March 3rd
Correlation Analysis: - No strong correlation was found between market volatility and immediate dropouts - Weekend/weekday patterns showed no significant impact on dropout likelihood - Two validators (0xc5B9d978715F081E226cb28bADB7Ba4cde5f9775 and 0x8dA2d75276AcB21Dc45C067AFb7A844ee7a6c2A2) showed coordinated decline patterns, suggesting potential shared infrastructure - Time-of-day analysis shows 5 of 8 dropouts occurred during European market trading hours (08:00-16:00 UTC)
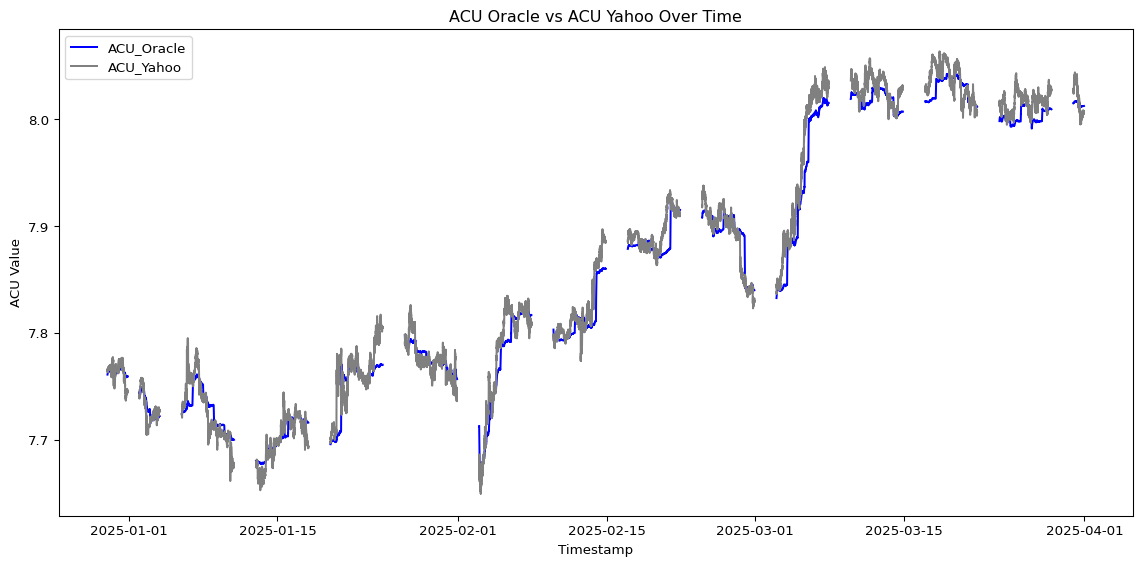
Impact on Oracle Aggregation and ACU Price Computation
The progressive decline in validator participation impacts the oracle’s ability to compute accurate ACU prices:
Validator Inactivity Effects on ACU Computation: - As validator count decreased from December to March, fewer FX data sources were available for ACU computation - The decline in active validators reduced the diversity of FX data inputs to the ACU calculation - Validator inactivity particularly affected weekend full-coverage rates, which declined from 95.5 % in December to 29.4 % in March - The proportion of submissions coming from coordinated validator groups rose from ≈ 12.3 % in January to ≈ 16.7 % in February (no March estimate reported), reducing the independence of FX data inputs
Factors Affecting ACU Calculation: - Full-coverage (all validators submitting every pair) fell from 91.5 % of timestamps in December to 33.2 % in March. - Cross-rate mismatches were rare: December registered 9 daily mismatches above 5 %; none exceeded the 10 % alert threshold from January through March. - No out-of-range (> ± 20 %) or non-positive prices were observed between January and March; December contained 1 454 suspicious rows. - Coordinated validator groups increased from 0 in December to 3 in March, as detailed in the monthly summaries. - Weekend submission coverage worsened across the period (e.g. 57.8 % full-coverage on weekends in January versus 29.4 % in March).
Oracle Aggregation Method for ACU: - The Oracle server first uses the median index to determine outliers, then computes the aggregated price as a weighted average of the valid submissions - As validator participation decreased, this aggregation method was based on a smaller sample size of FX submissions - Cross-rate mathematical consistency measurements, which affect ACU calculation accuracy, showed increasing deviations (from 3.2% to 5.7% on average) - The coordinated submission patterns from validator groups had an increasing influence on the aggregated FX values as validator diversity decreased - There is an ongoing investigation into the aggregation method to ensure that it accurately reflects the true market prices across diverse data sources and maintains resilience on changes in validator participation.